Average of BMI Chart for Women by Age
One of the ways to calculate the fatness is through body mass index (BMI). However, calculating BMI is not that simple. It should be done based on some factors such as sex and age. In this article we will focus on the BMI chart for women by age. So, if you are a woman, you have to pay attention to the following discussion.
Other Methods to Measure Obesity
Besides, women’s BMI chart by age, there are some other methods that can be used to measure obesity. One of them is skinfold thickness measurement calipers. Besides that, there is also an underwater weighing. Then, you can also consider bioelectrical impedance. Dual-energy x-ray absorptiometry or DXA also becomes one of the alternatives. Another option is an isotope dilution. However, they need to train personnel.
Why Should We Use BMI?
Actually, there are many methods how to determine whether people belong to underweight, ideal, overweight or even obese. However, BMI chart for women by age can be considered as one of the best ways. Besides that, it is also very easy to understand and use. So, you should try calculating your body mass using this BMI chart.
The Risks and Assessments Related to BMI Chart
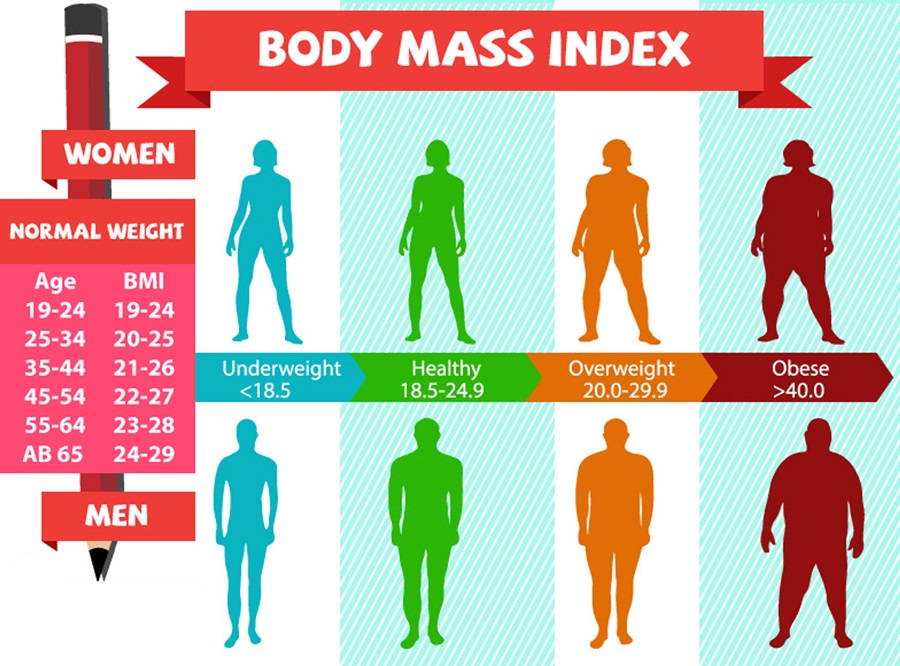
If you read the BMI chart by age for women, you will know your own body mass. It means you know the condition of your health condition, too. In fact, BMI always relates to some risks of health problem and also assessments. If you belong to overweight or obese, it means you have a higher risk of high blood pressure, cardiovascular diseases, etc. On the contrary, if you belong to underweight, you must improve your body mass by doing exercises, eating more healthy foods, etc.
The National Average of BMI chart for Women by Age

bmi chart for women by age
Based on the age, BMI for women is divided into 5 categories. This chart is only for women who are 20 years old or older. Firstly, women at 20 up to 29 years old have median BMI 24.4. For those who are 30 up to 39 years old, the median BMI is 26.4. Women with 40 up to 49 years old have 27.8 of median BMI. Next, 28.4 are the median BMI for women who are 50 up to 59 years old (read: BMI Calculator for Women Over 50). Last, women with 60 up to 69 years old have a median BMI at 27.5. From this BMI chart for women by age, you can determine to which classification you belong to.
Other BMI Charts
Can BMI chart be used by kids or children? Actually, this BMI chart can be used by any woman at any age. However, it is only recommended for those who are 20 years or above. Even though the result may be accurate enough, some cases may not be accurate for kids. So, if you want to calculate the BMI of your daughter, it will be better if you wait until she gets 20 years old.
How about men? Based on the sex, BMI chart is divided into 2 categories: for men and for women. Therefore, if you are a man, BMI chart for women by age may not be appropriate for you. In fact, there are some differences between BMI chart for men and women. So, men should use BMI chart men and vice versa.
What to Do If You Are Underweight, Overweight or Obese?
If you belong to underweight, you have to increase your body mass. There are many ways that you can do. The most effective and most recommended way is by doing exercises. In this case, the exercise you most need is lifting weight. It can help you increase body mass fast. Besides that, you may need to add the portion of eating, but make sure that you eat healthy foods. Then, you can see BMI chart for women by age again after a few weeks.
If you belong to overweight or even obese, you should have weight loss diet. The diet may not only include food, but also exercise. In this case, I suggest you to do cardio exercises. Other ideas are aerobics or HIIT exercises. After you feel that you successfully improve body mass, you can see BMI chart for women by age again to know the progress.


Leave a Comment